Hi, I'm Dharani Sri.
A
As a Data Analyst, I am passionate about transforming raw data into actionable insights using Python, SQL, Excel, and Tableau to empower businesses with data-driven decision-making.
About
Electronics and Communication Engineering graduate with knowledge of Power BI, Tableau, Excel, and Python visualization libraries. I am interested in building a career in Data Analytics by transforming raw data into meaningful insights and creating interactive dashboards. I am eager to support data driven decision making while continuously improving my technical and analytical skills.
Education
Dr Mahalingam college of Engineering and Technology
Pollachi , Coimbatore
Degree: EC(Advanced communication Technology)
CGPA: 8.667
Experience

- Developed interactive dashboards and visual reports in Power BI and Tableau to help business teams monitor key performance indicators (KPIs) and user engagement metrics.
- Used DAX functions in Power BI to build calculated columns and measures for simple business calculations like growth rates and performance scores.
- Created 2 custom visualizations in Power BI and 2 in Tableau using Python scripts and R scripts for data analysis and display.
- Automated basic data cleaning and preprocessing with Python (Pandas) and Excel formulas, boosting accuracy for reports.Practiced Python basics for data handling; collaborated on turning data needs into clear visuals for better decisions.
- Tools: Power BI, Tableau, Python (Matplot,Seaborn,Numpy), Excel

- Built a simple Sales Performance Dashboard in Power BI to show total revenue, sales trends, product performance, and region comparisons.
- Created a basic Customer Satisfaction Dashboard in Power BI to track feedback, Net Promoter Score (NPS), and customer sentiment over time.
- Used DAX functions to make custom measures like monthly sales growth, customer retention rates, and average satisfaction scores.
- Cleaned and transformed data with Power Query from Excel sources to keep everything accurate and consistent.Shared clear reports with team leads using Power BI, Excel, DAX, and Power Query for better business decisions.
- Tools: Power BI, DAX, Excel, Power Query
Projects

An audio amplifier increases the power of an audio signal, making it strong enough to drive speakers or headphones.
-
Components:
- Breadboard
- LM386 IC
- 1.2K Ohm and 10 Ohm Resistors
- 10muF , 220muF , 104pF , 47nF Capacitors
- Headphone Jack
- Battery 9v and Battery clip
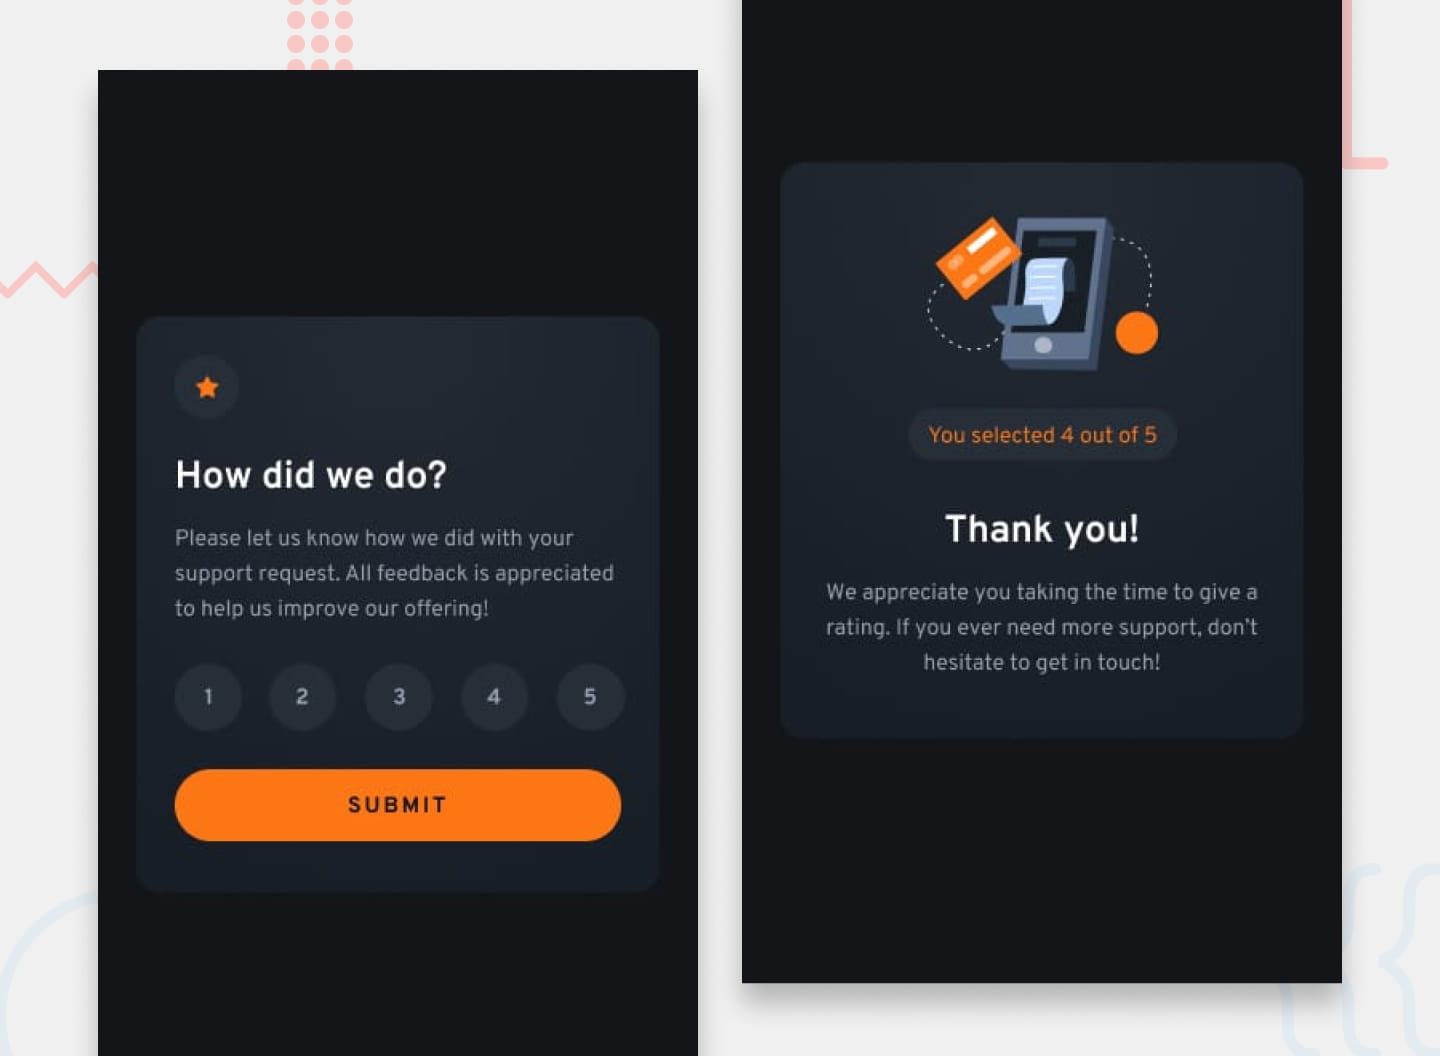
A testimonial is a positive statement from a customer about a product or service,often used in marketing to build trust and credibility.
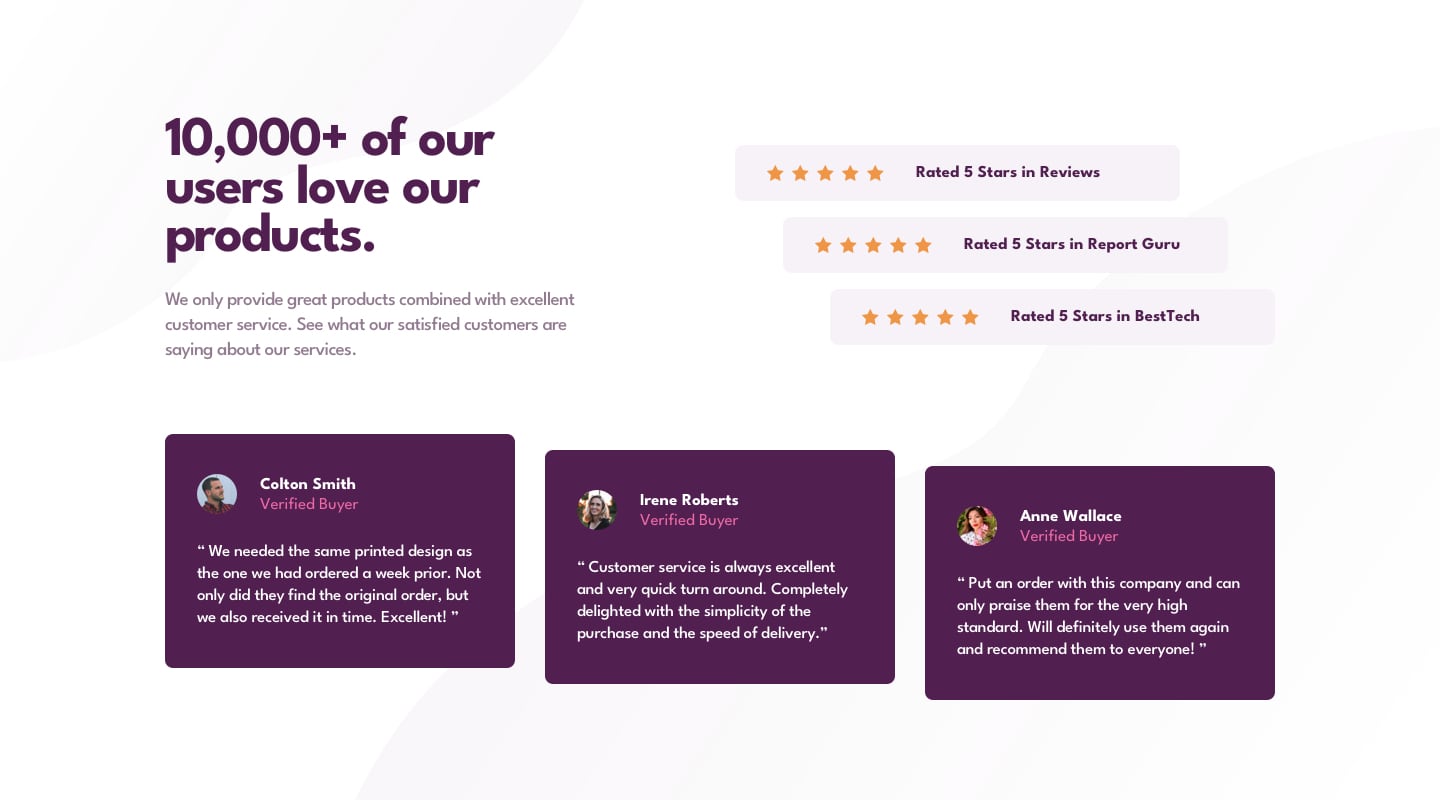
A responsive social proof section with a focus on layout and responsiveness.
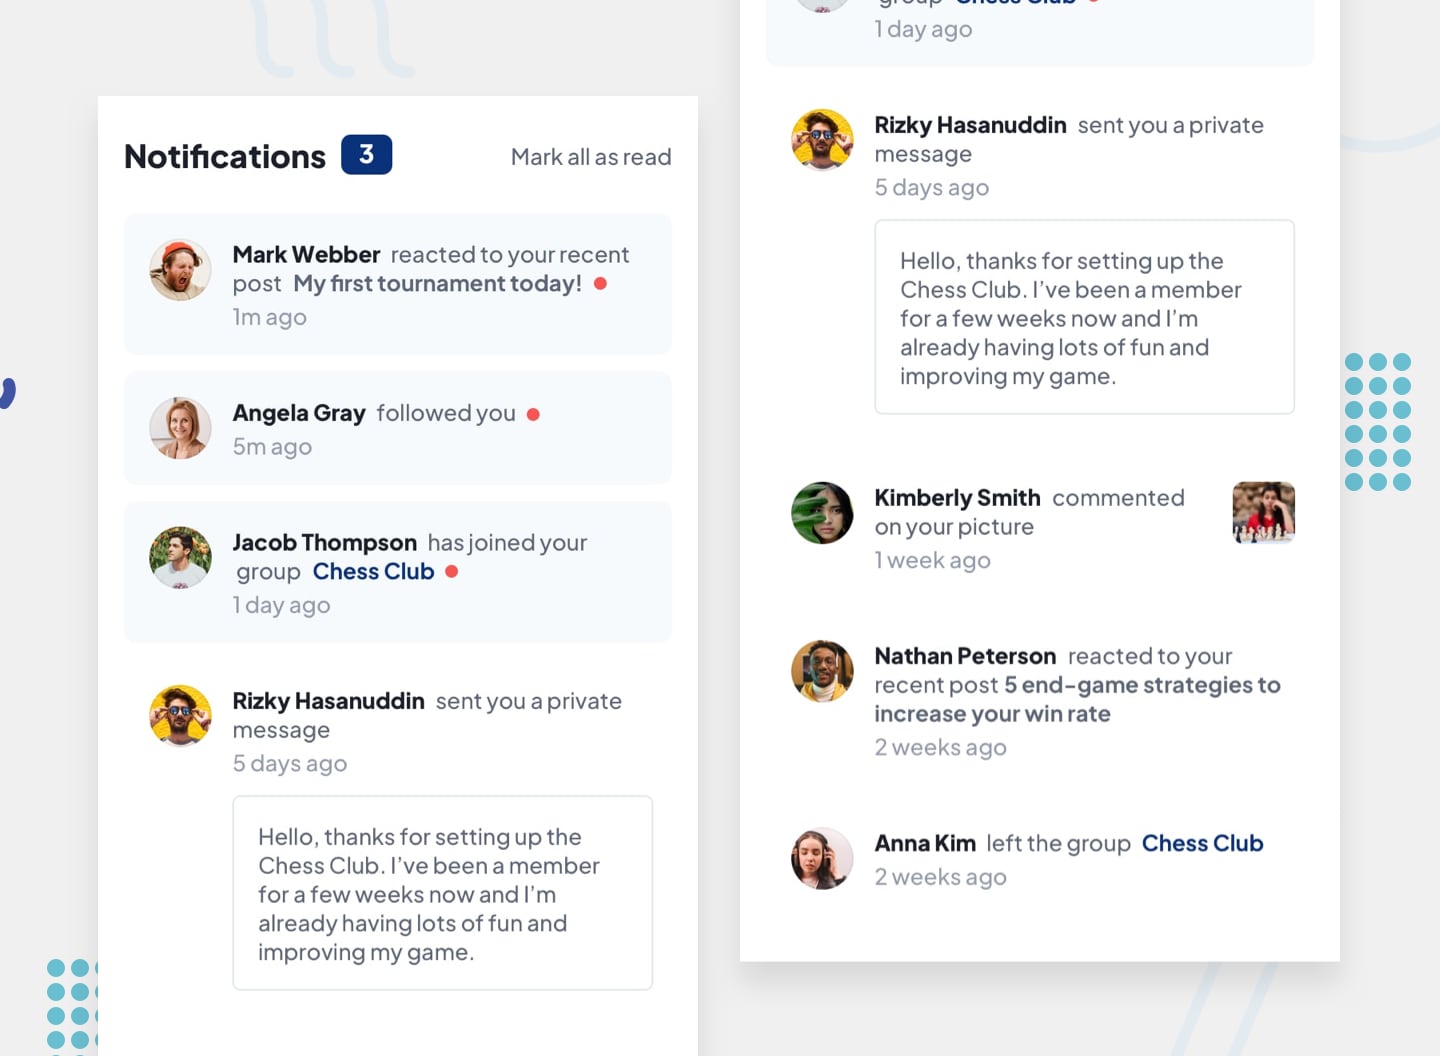
A responsive page that displays notifications and allows users to mark them as read.
-
Tools: HTML, CSS,JavaScript
- Users can view a list of recent notifications with clear visual indicators for unread vs. read messages.
- Admins or system users can dynamically generate and manage notification content through mock data or API integration.Users can mark individual notifications as read or mark all as read with a single action.
Focused on responsive design, smooth active states, and intuitive user interaction.
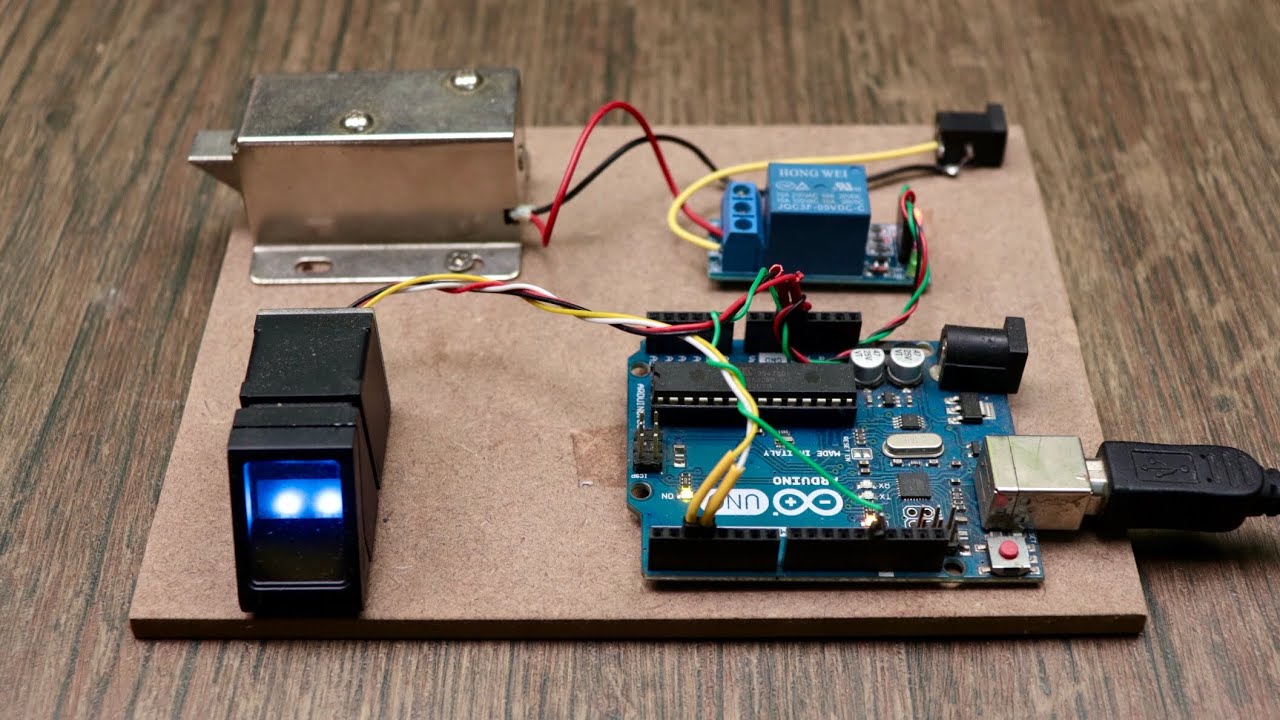
A solenoid lock project using an Arduino Uno involves using the Arduino to control a relay,which then switches power to a solenoid lock,allowing for electronic locking and unlocking of a door or other mechanism.

This HR Analytics Dashboard, likely built with Power BI, provides insights into employee attrition and other key HR metrics.
Skills
Languages and Tools
 Java
Java
 C
C
 HTML
HTML
 CSS
CSS
 Tableau
 Excel
Excel
 Power BI
 Multisim
 VS Code
 Canva
Canva
Libraries And Databases
 Seaborn
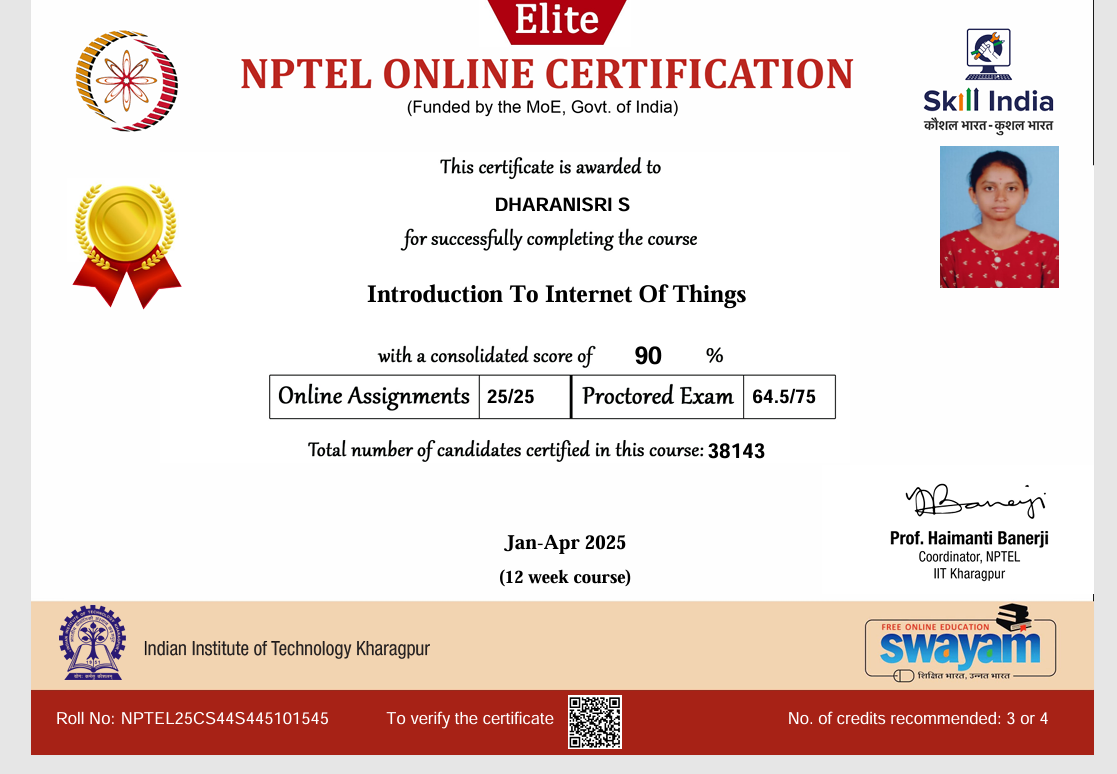
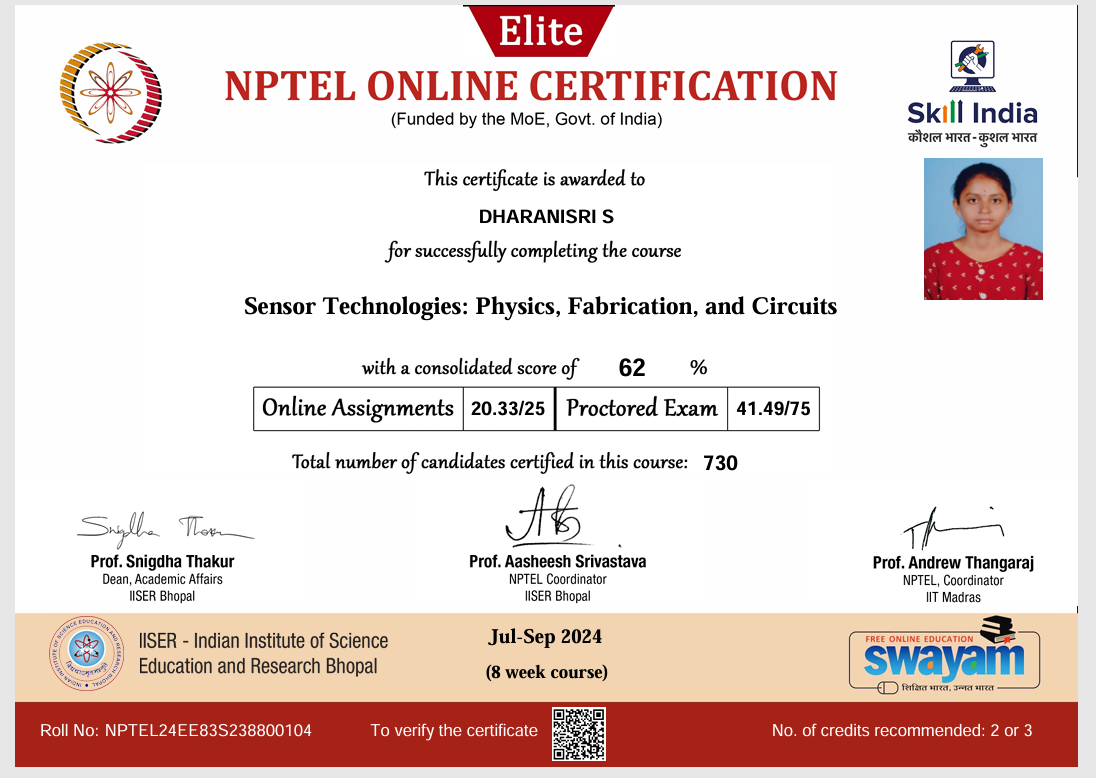
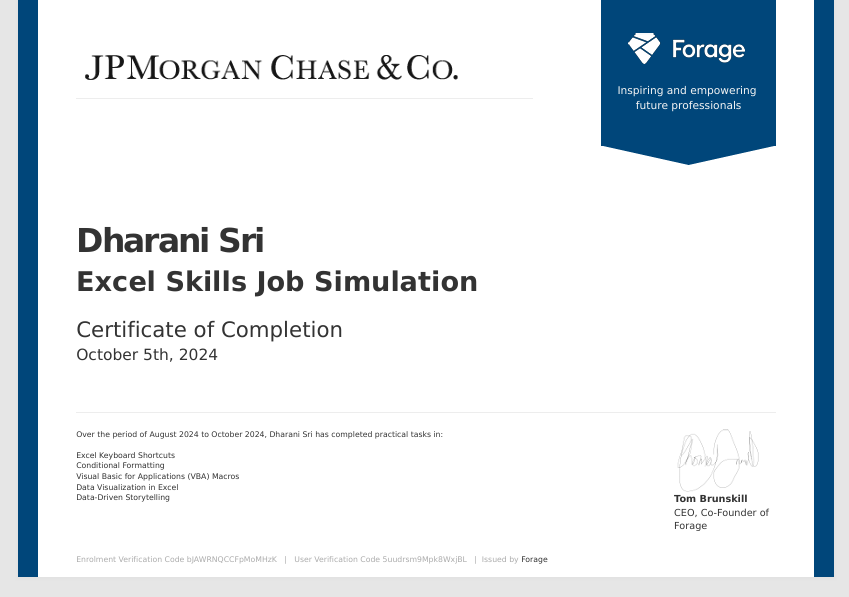
Certificates